Stackdriver → Google Cloud
Data visualization research · canvas-rendered d3Role: Leadership team · Data Visualization Research
Presented Stackdriver in FAANG-level partnership and acquisition conversations leading to the Google acquisition. Product research on data visualization methods for cloud computing logs and events was a direct driver of the outcome.
Continued at Google designing the data-visualization and charting library for developer tools (Cloud Monitoring, Cloud Logging). Shipped a canvas-based rendering method for d3.js — a memory-efficient technique developed to handle the scale of infrastructure telemetry data that SVG-based d3 could not.
Also designed the Metric Explorer, a calendar component used across Cloud products, and onboarding flows that streamlined first-time login and increased user engagement and retention.
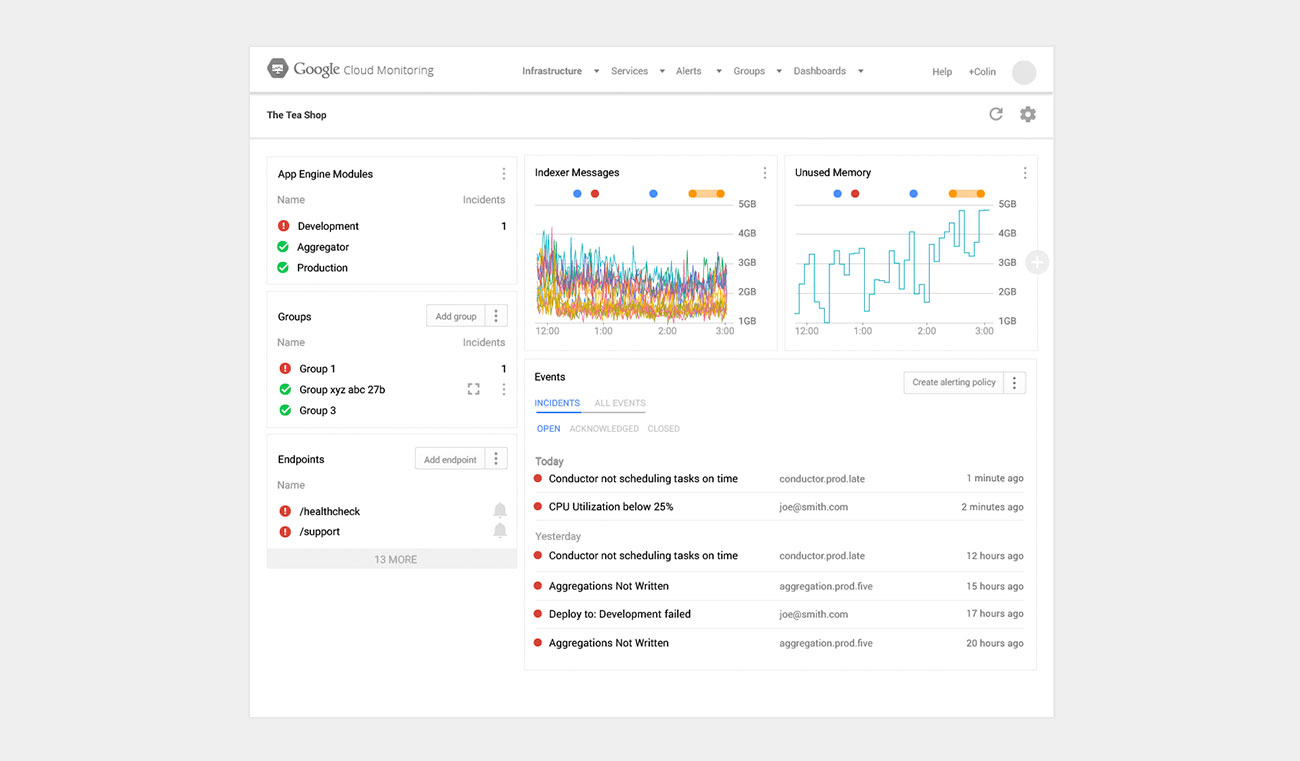
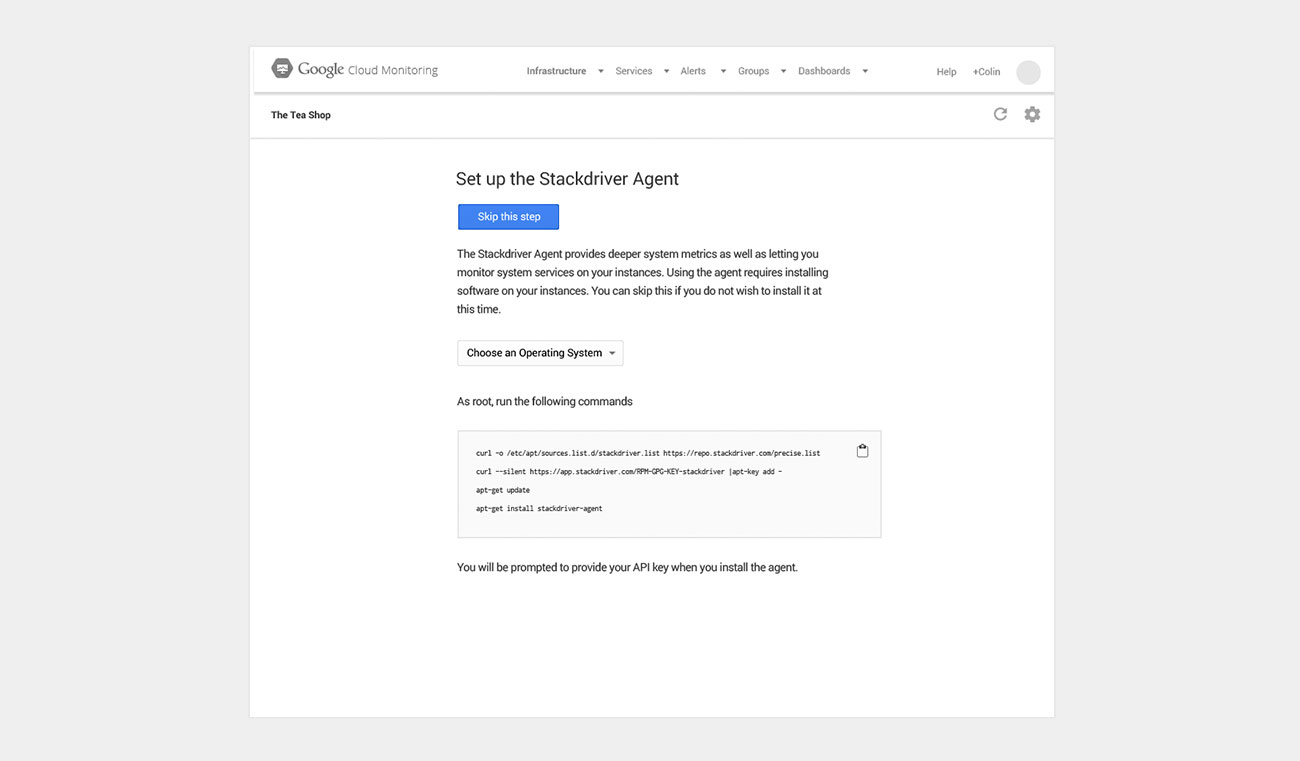
Monitoring onboarding
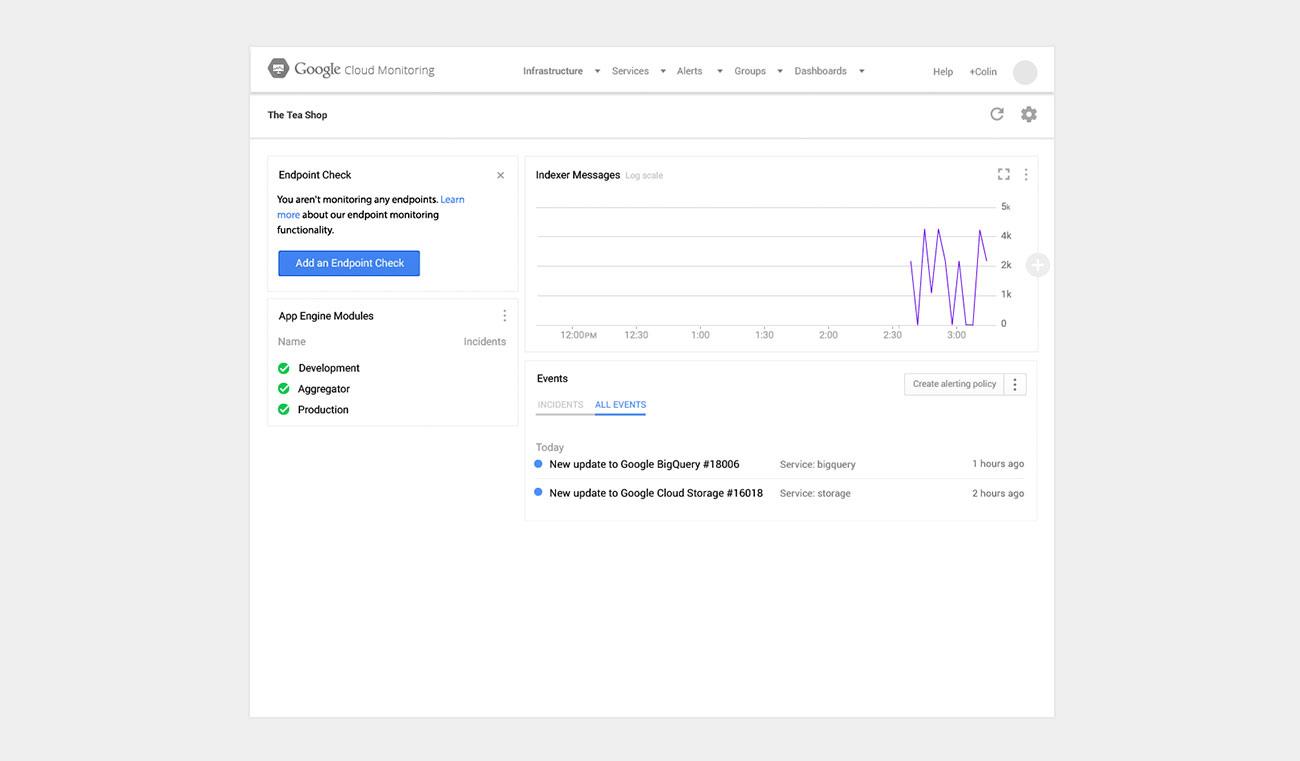
Monitoring first-time login
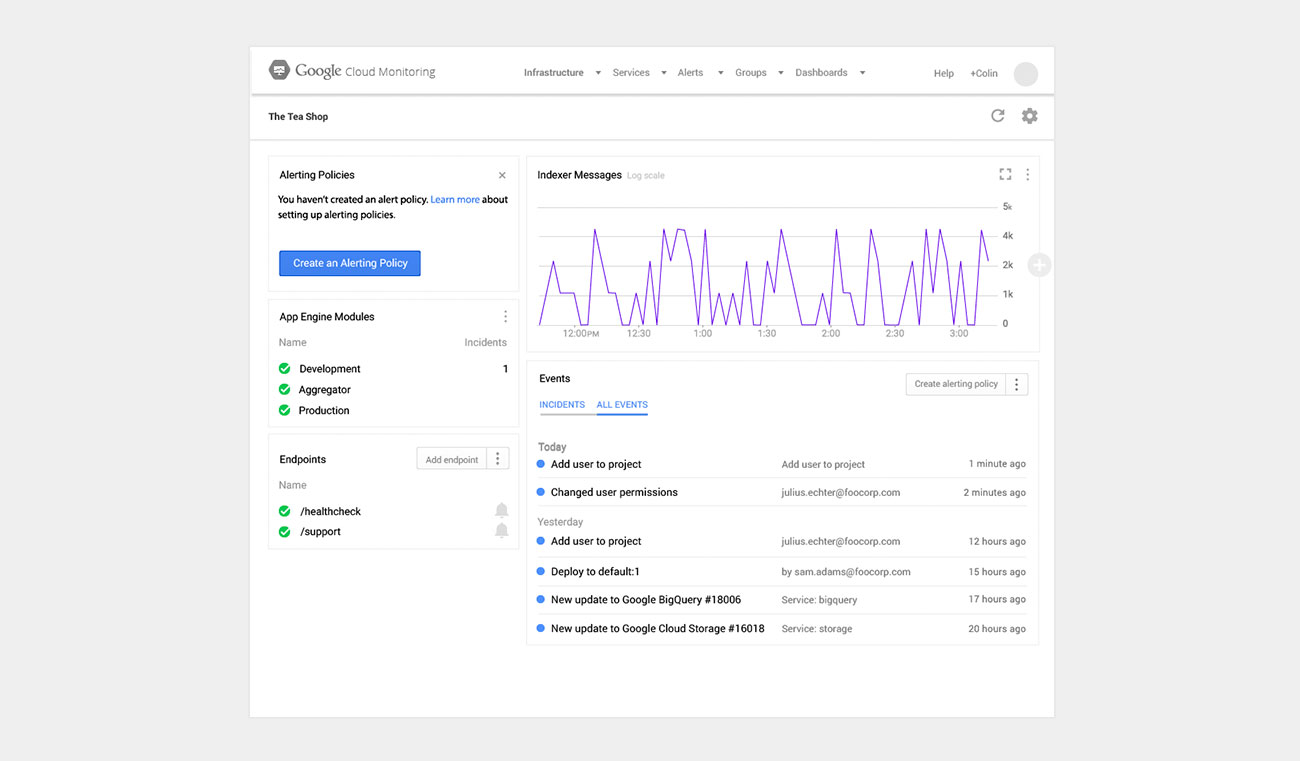
Monitoring login after adding services
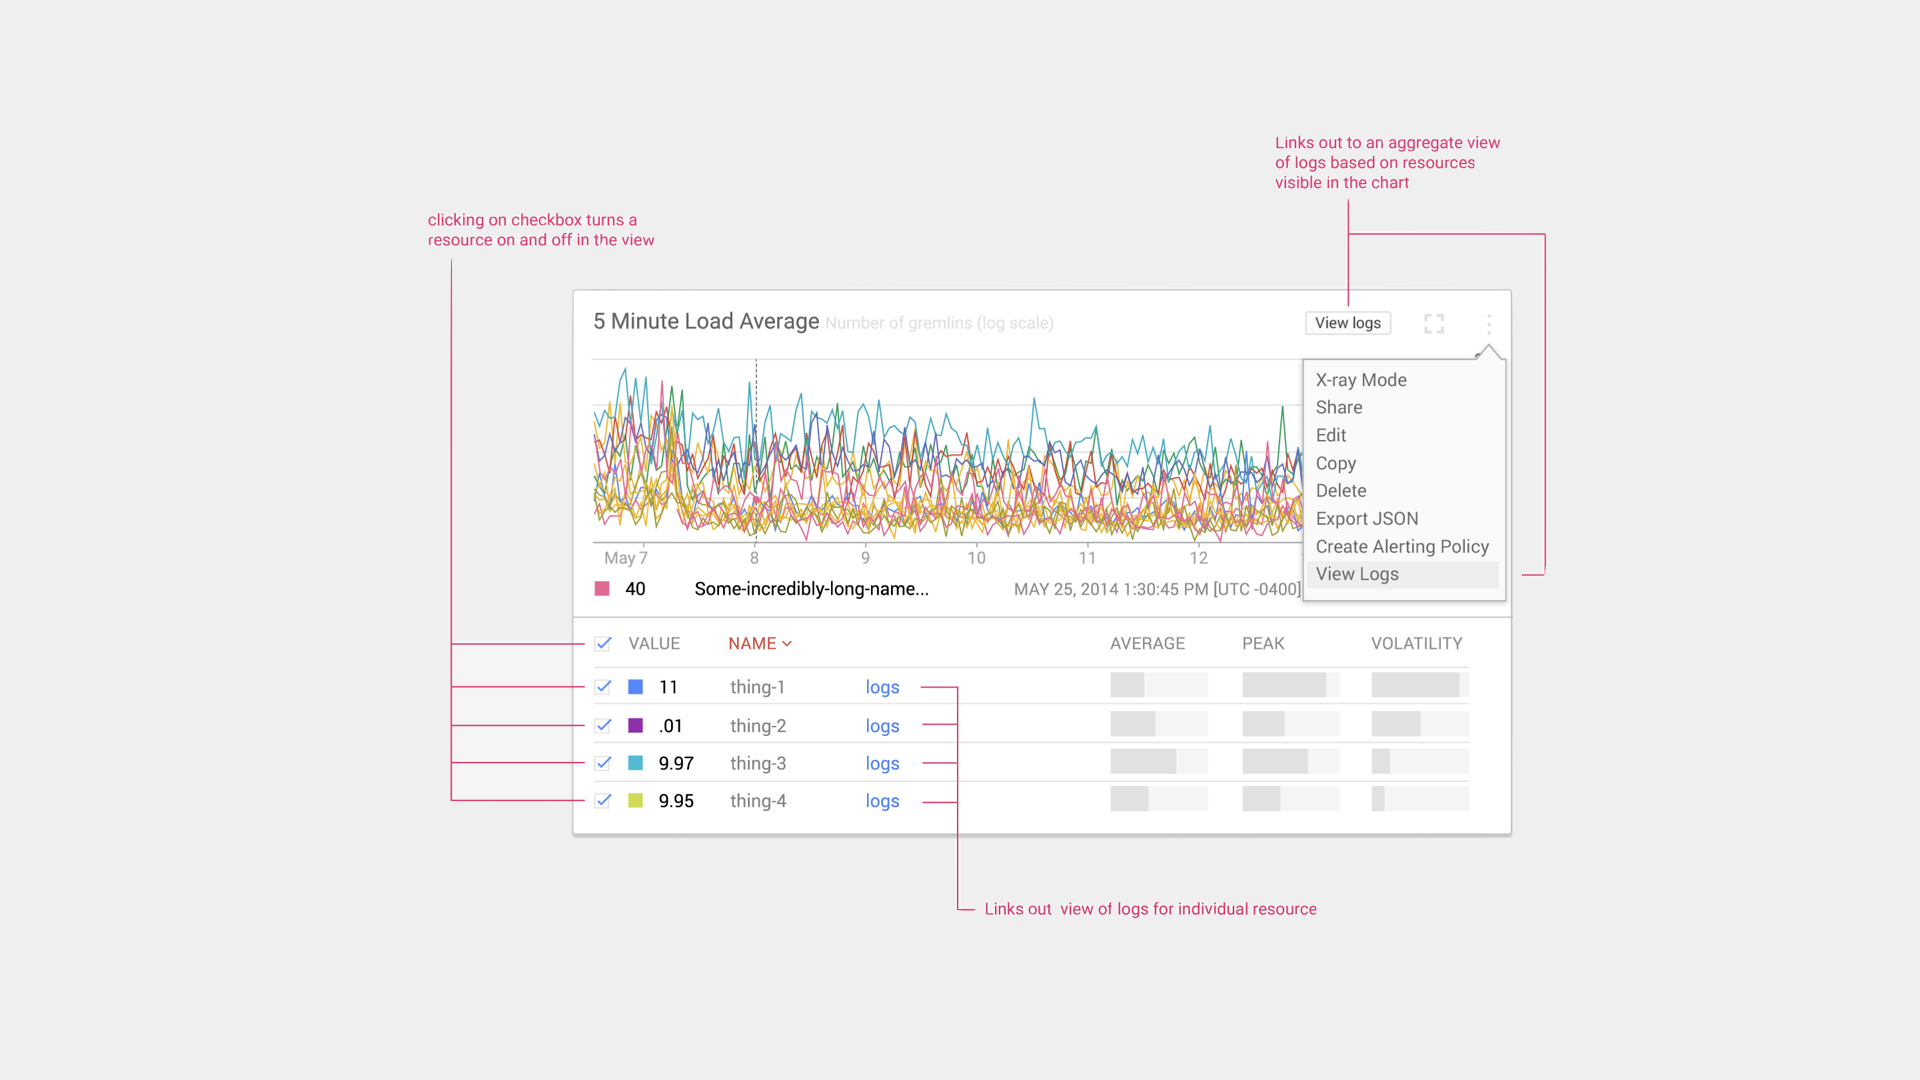
Google Cloud time-series charting spec
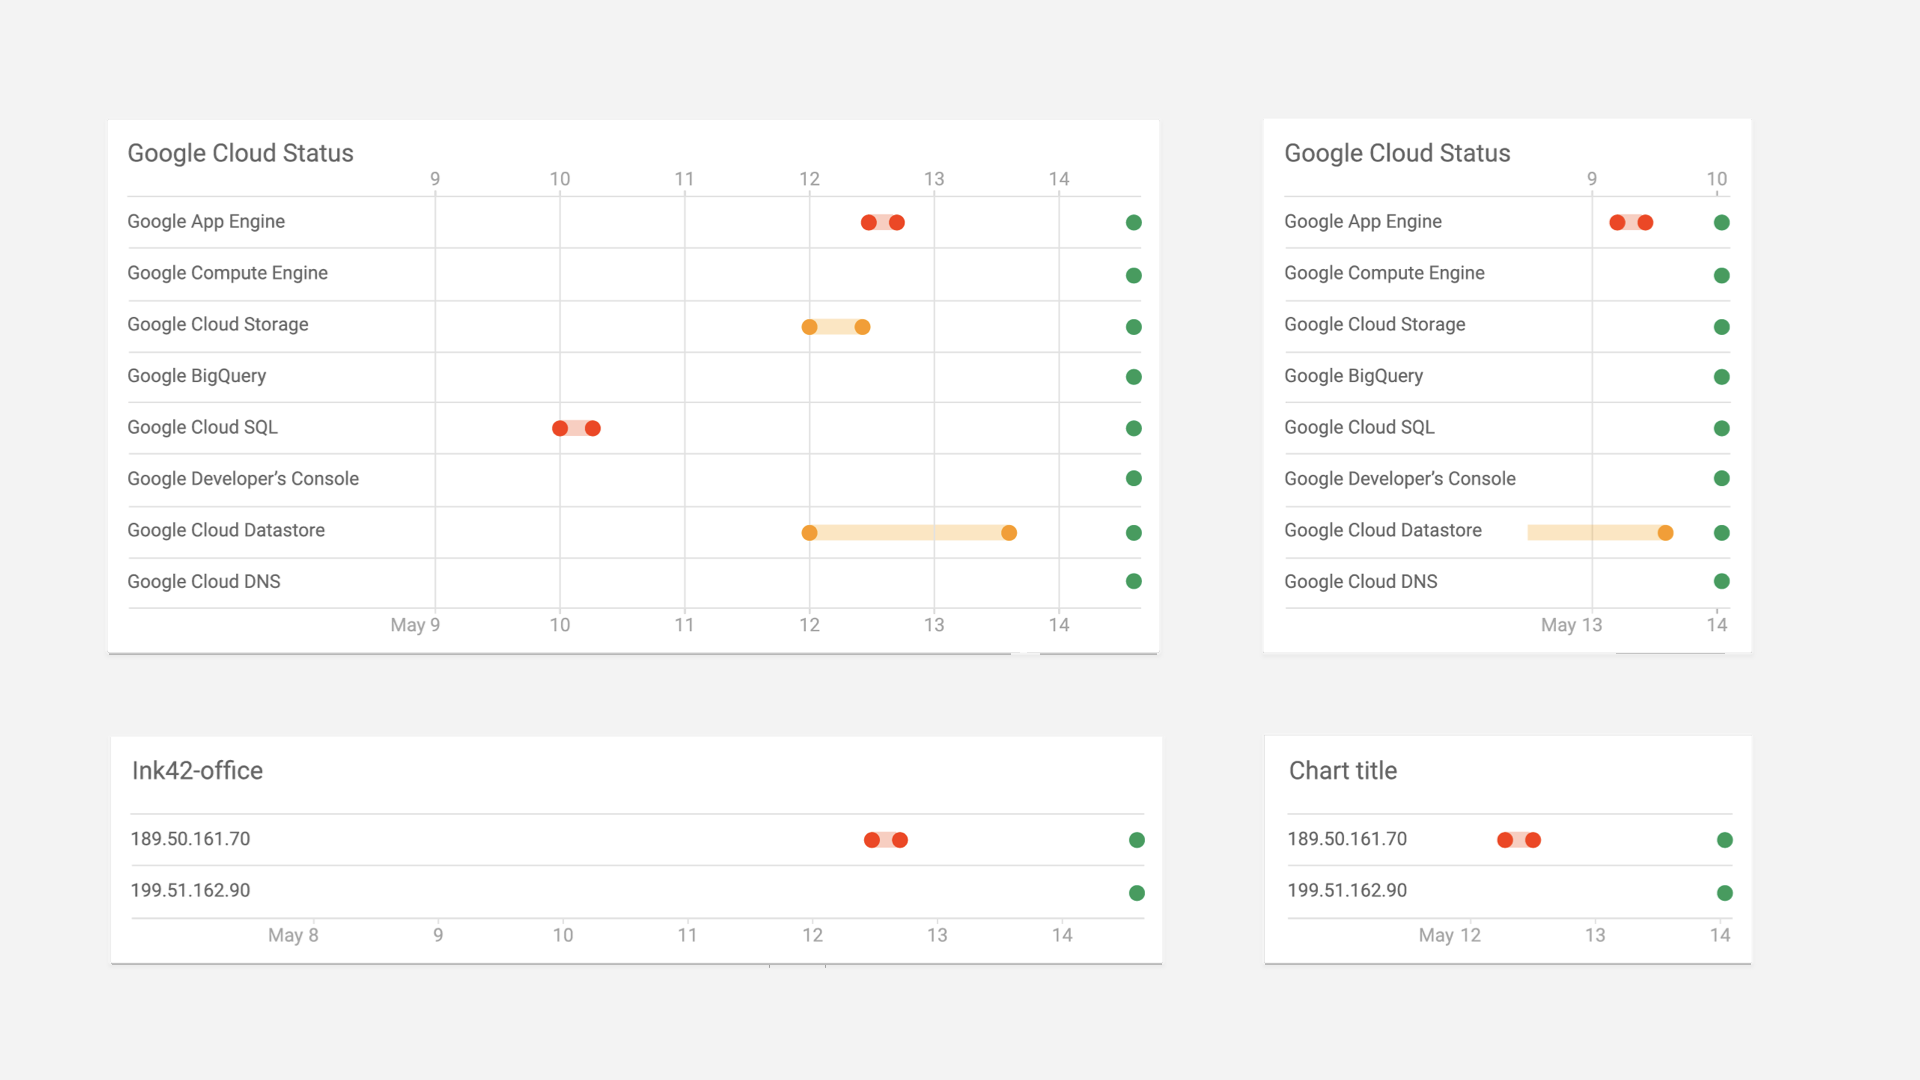
Google Cloud event charting
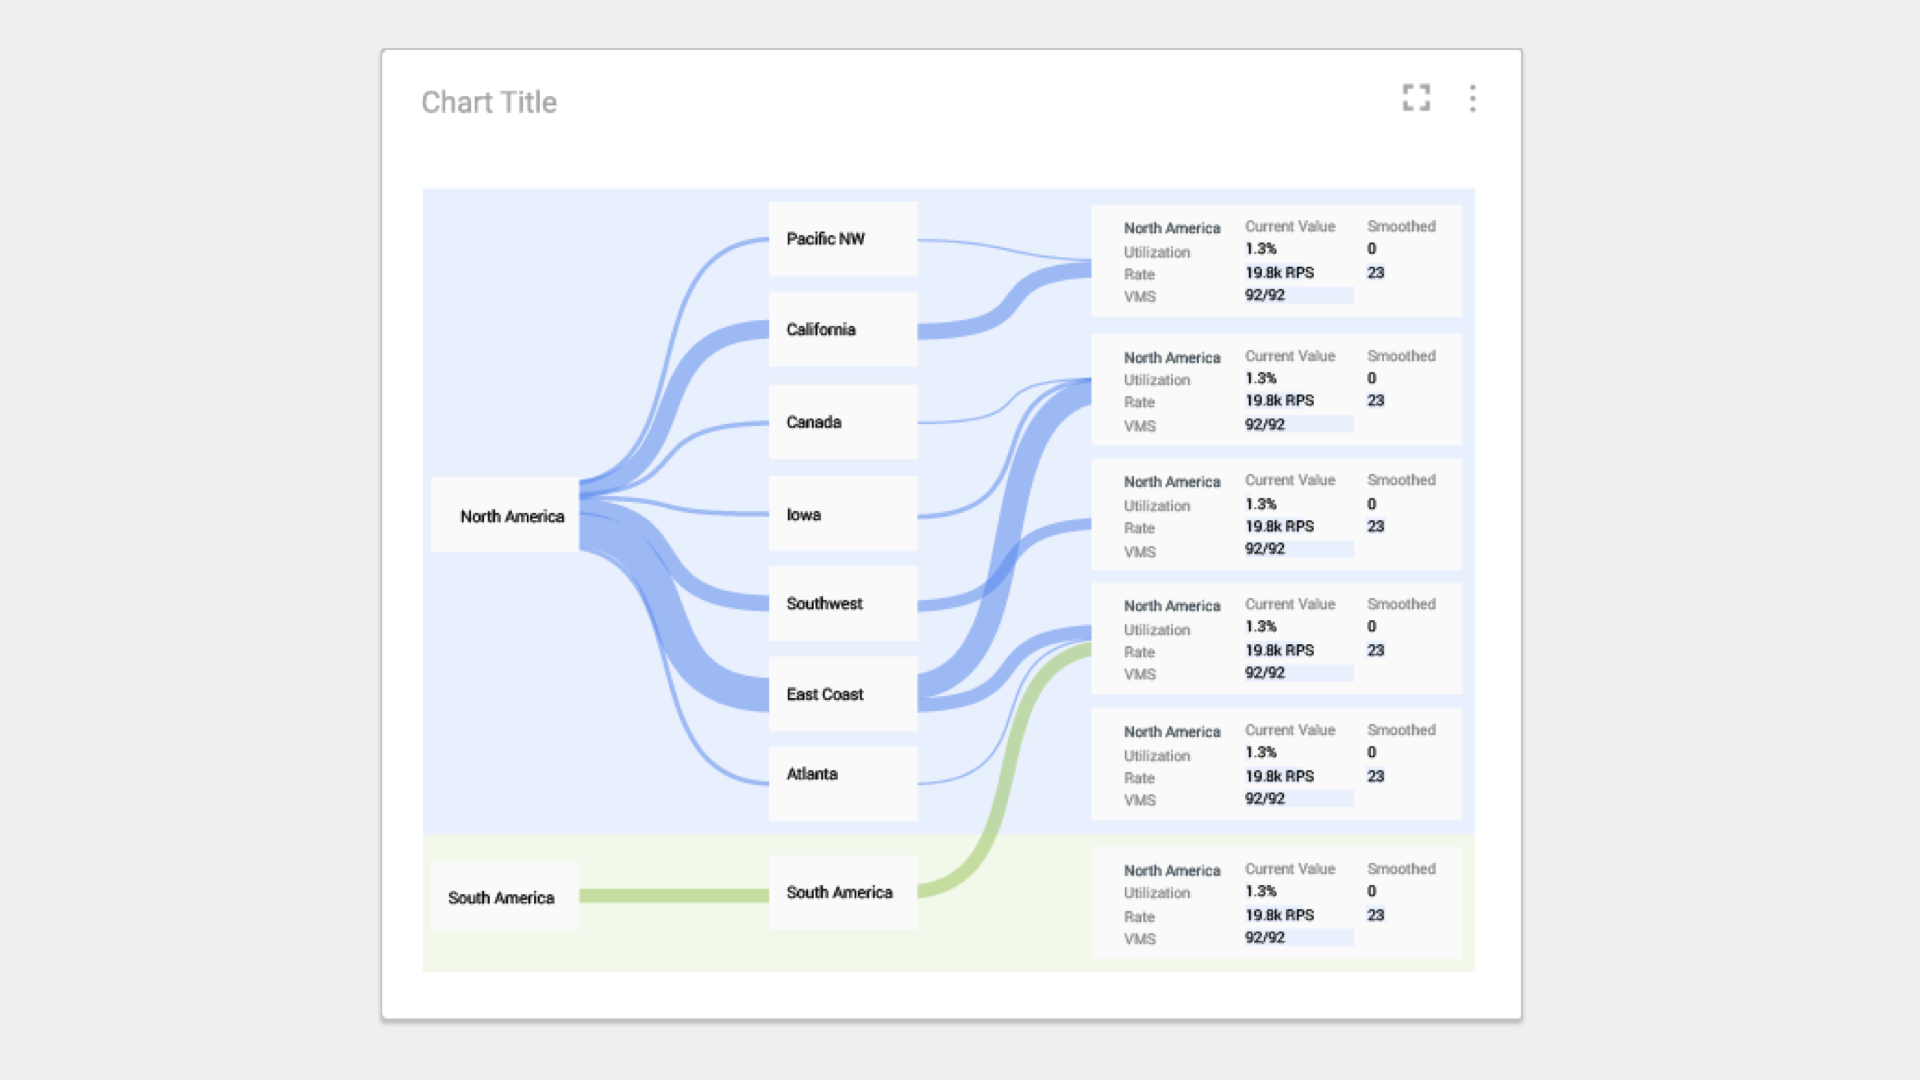
Google Cloud data-flow chart
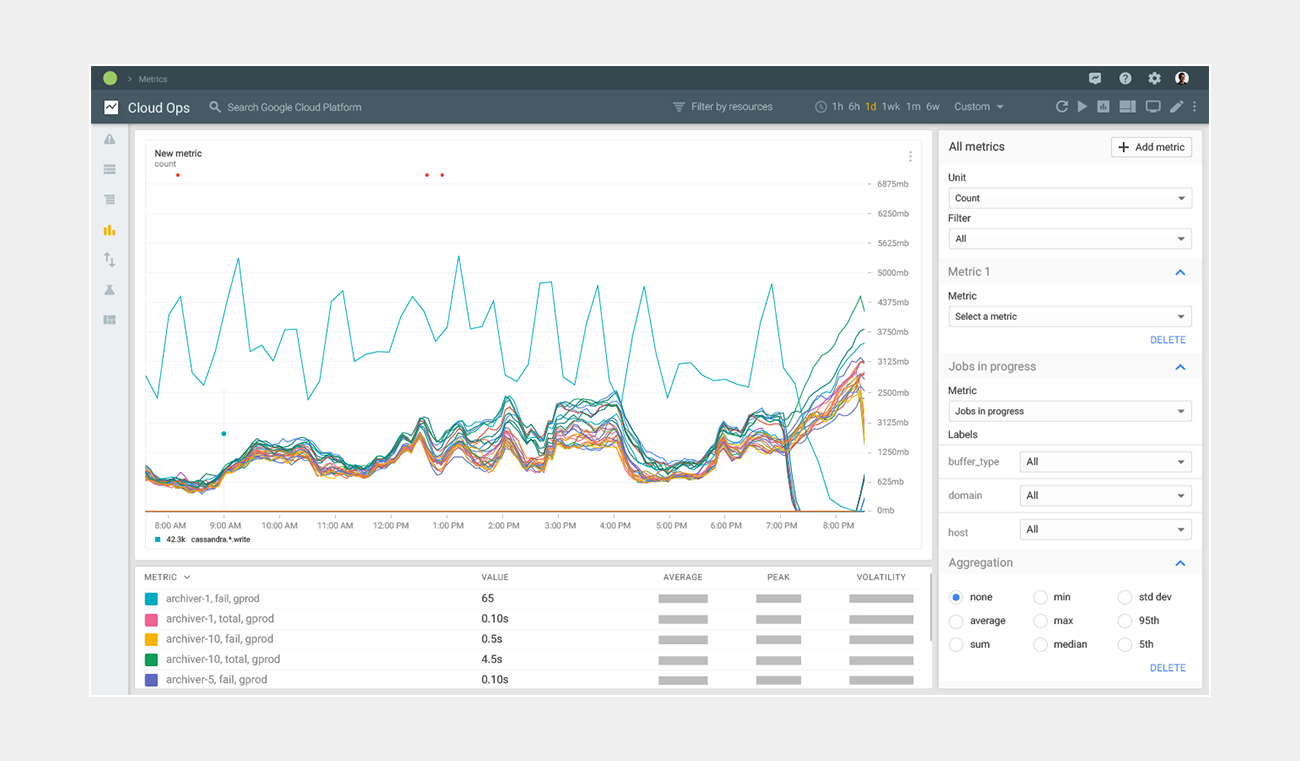
Monitoring metrics explorer
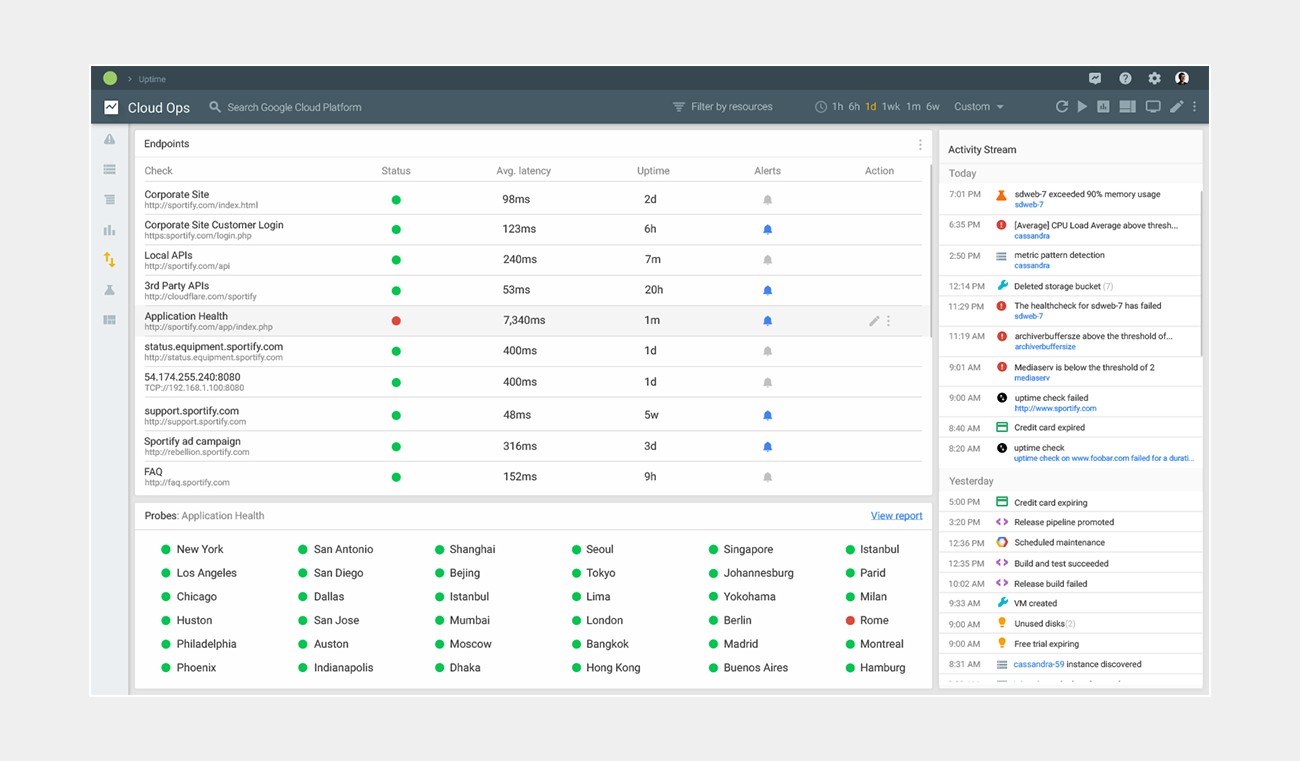
Monitoring endpoints
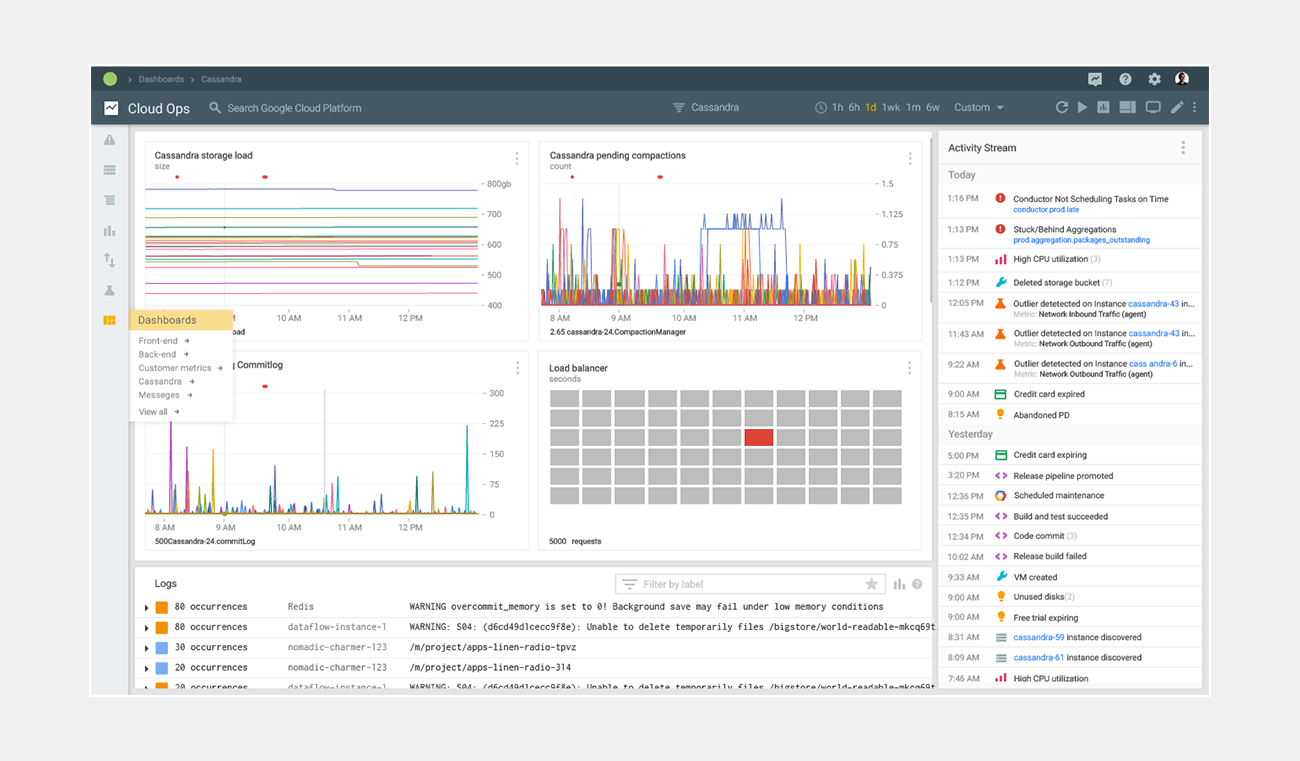
Monitoring dashboard
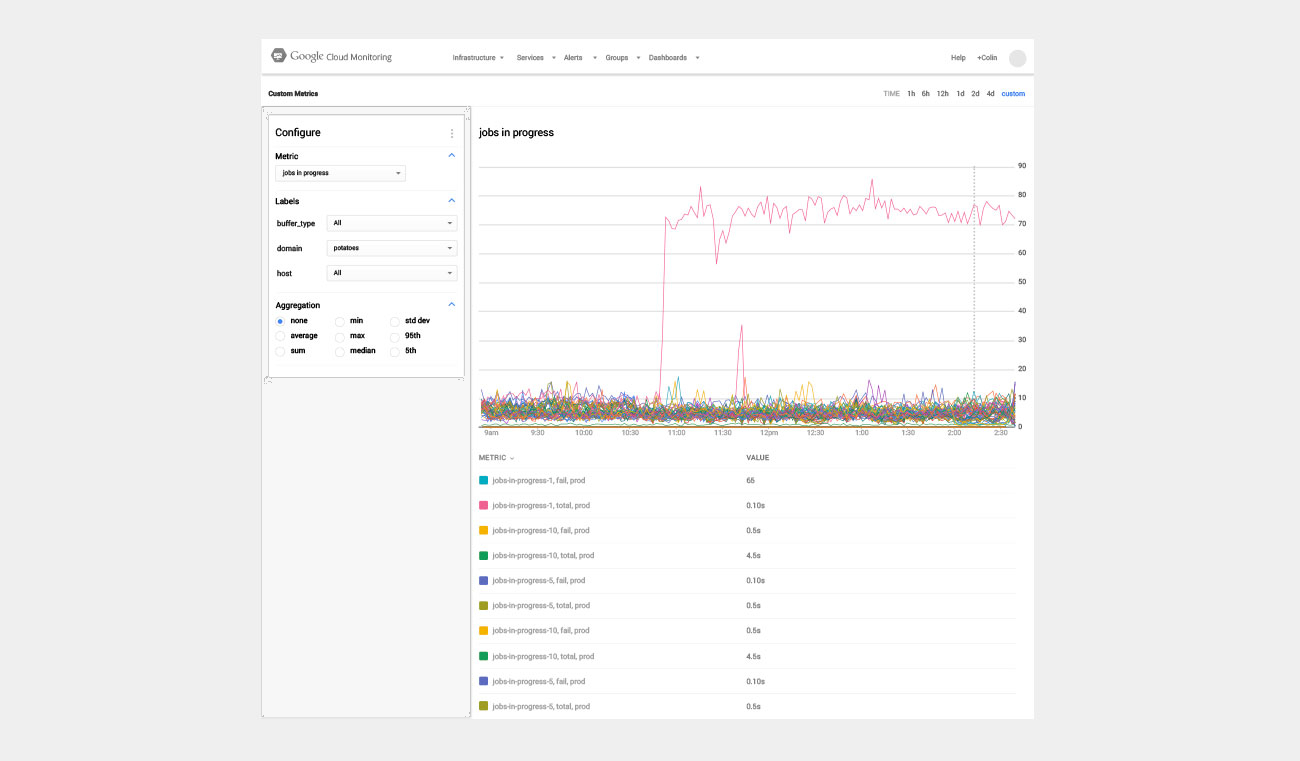
Metrics explorer configuration
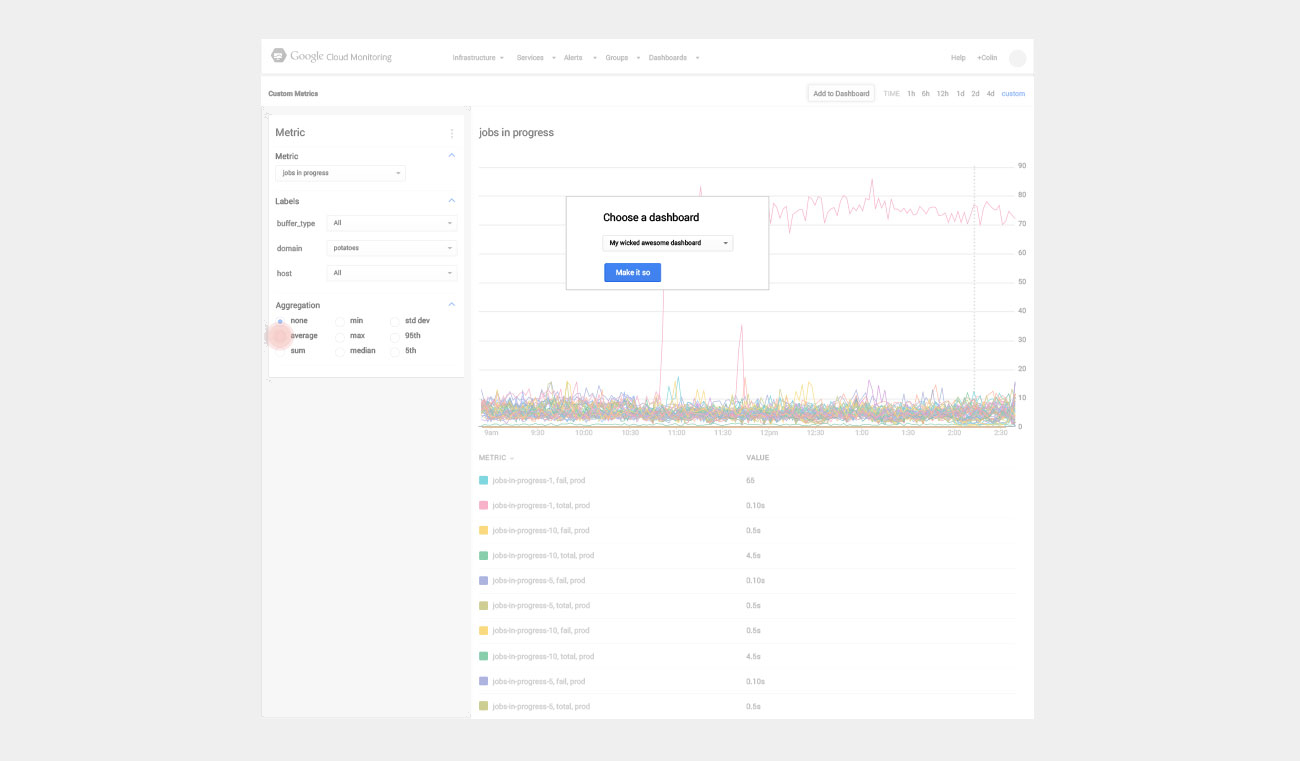
Metrics explorer — add to dashboard
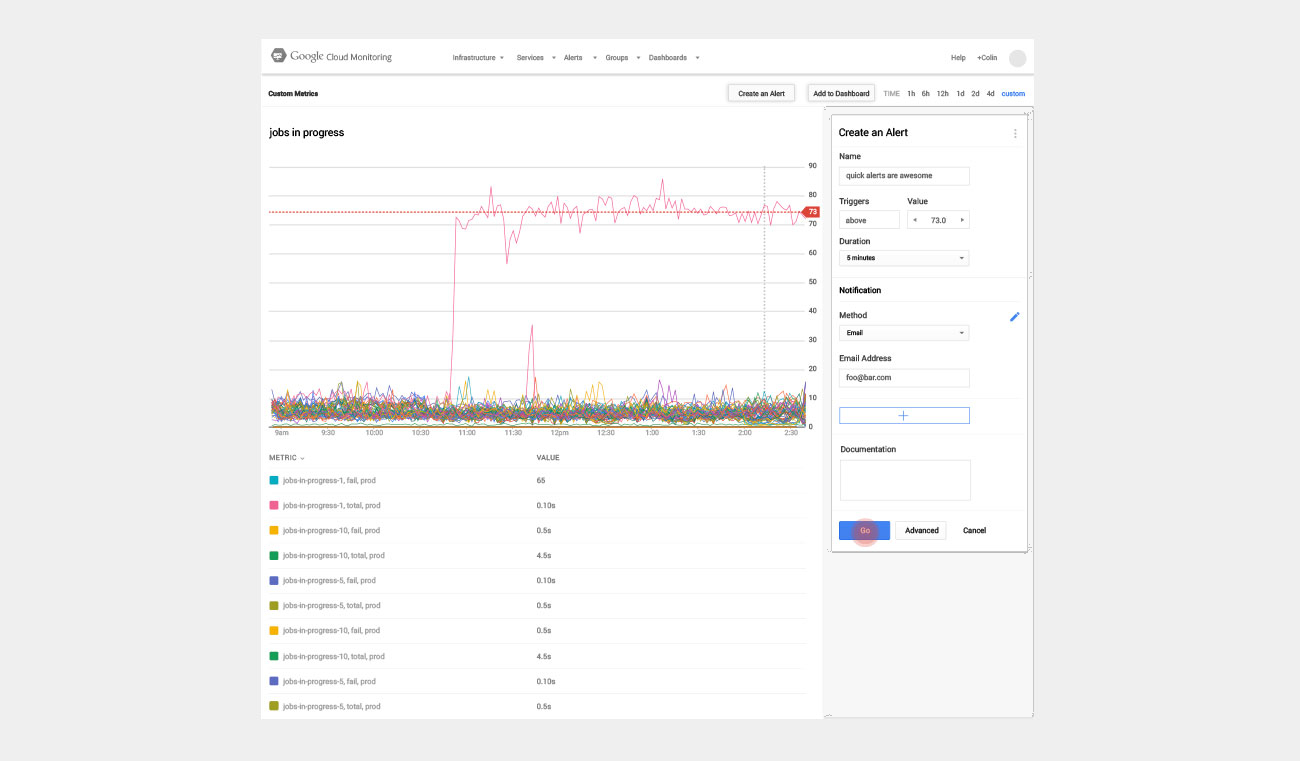
Metrics explorer alert configuration